

Canvas provides a range of tools and features that enable instructors to track data related to their course, including grades, student activity and communication. These insights can be used to tailor learning, identify areas of difficulty and adapt assessments where needed.
The analytical tools within Canvas are broadly divided into two areas: Course Analytics and Quiz Analytics.
Course Analytics
Full Guidance: What is Course Analytics? 🔗
As the name suggests, Course Analytics provides an overview of activity and performance across your course. This includes metrics such as page views over a selected time period, as well as student-level data including average grades and participation statistics.
Accessing the Tool
Course Analytics is available in all Canvas courses. To access it, open your chosen course and select Course Analytics from the course navigation menu. You may also find a link in the options panel on the right-hand side of the course home page — both routes will take you to the same tool.

Course Analytics – Features
Click on each heading to expand.
Course Grade ⬇️
This area provides a breakdown of grades across the course, including individual assignments and sections. It also allows you to send targeted messages to students within specific score ranges, or to those who have not submitted an assignment.
Weekly Online Activity ⬇️
View page and participation data across your course. You can compare which pages and files have received the most views, as well as track page views and interactions on a week-by-week basis.
- How do I view weekly online activity analytics in an interactive chart graph in Course Analytics?
- How do I send a message to all students based on specific course participation criteria in Course Analytics?
- How do I send a message to an individual student based on specific course participation criteria in Course Analytics?
Students ⬇️
View grade and participation data for individual students within the course. You can see a student’s most recent page view, review their interactions with the course over time and monitor their grades.
Reports ⬇️
Run and download reports covering a range of assignment metrics, including missing, late or excused submissions, as well as overall course activity. A class roster is also available, providing a list of all students enrolled on the course.
Quiz Analytics
Full Guidance: How do I view reports for a quiz in New Quizzes? 🔗
Instructors can gain detailed insights into quiz performance within a course. For each quiz, three types of reports are available for download:
- Quiz and Item Analysis
- Outcomes Analysis
- Student Analysis
Accessing Quiz Analytics
Quiz Analytics is available for any Canvas quiz with at least three submissions. To access it, open your chosen quiz in the course and go to the Quiz Builder, then select Reports.
If this is your first time using the tool, you’ll see a view similar to the example below. To start exploring the features, click Generate/View Report.
Quiz Analytics – Features and Reports
Click on each heading to expand.
Quiz and Item Analysis ⬇️
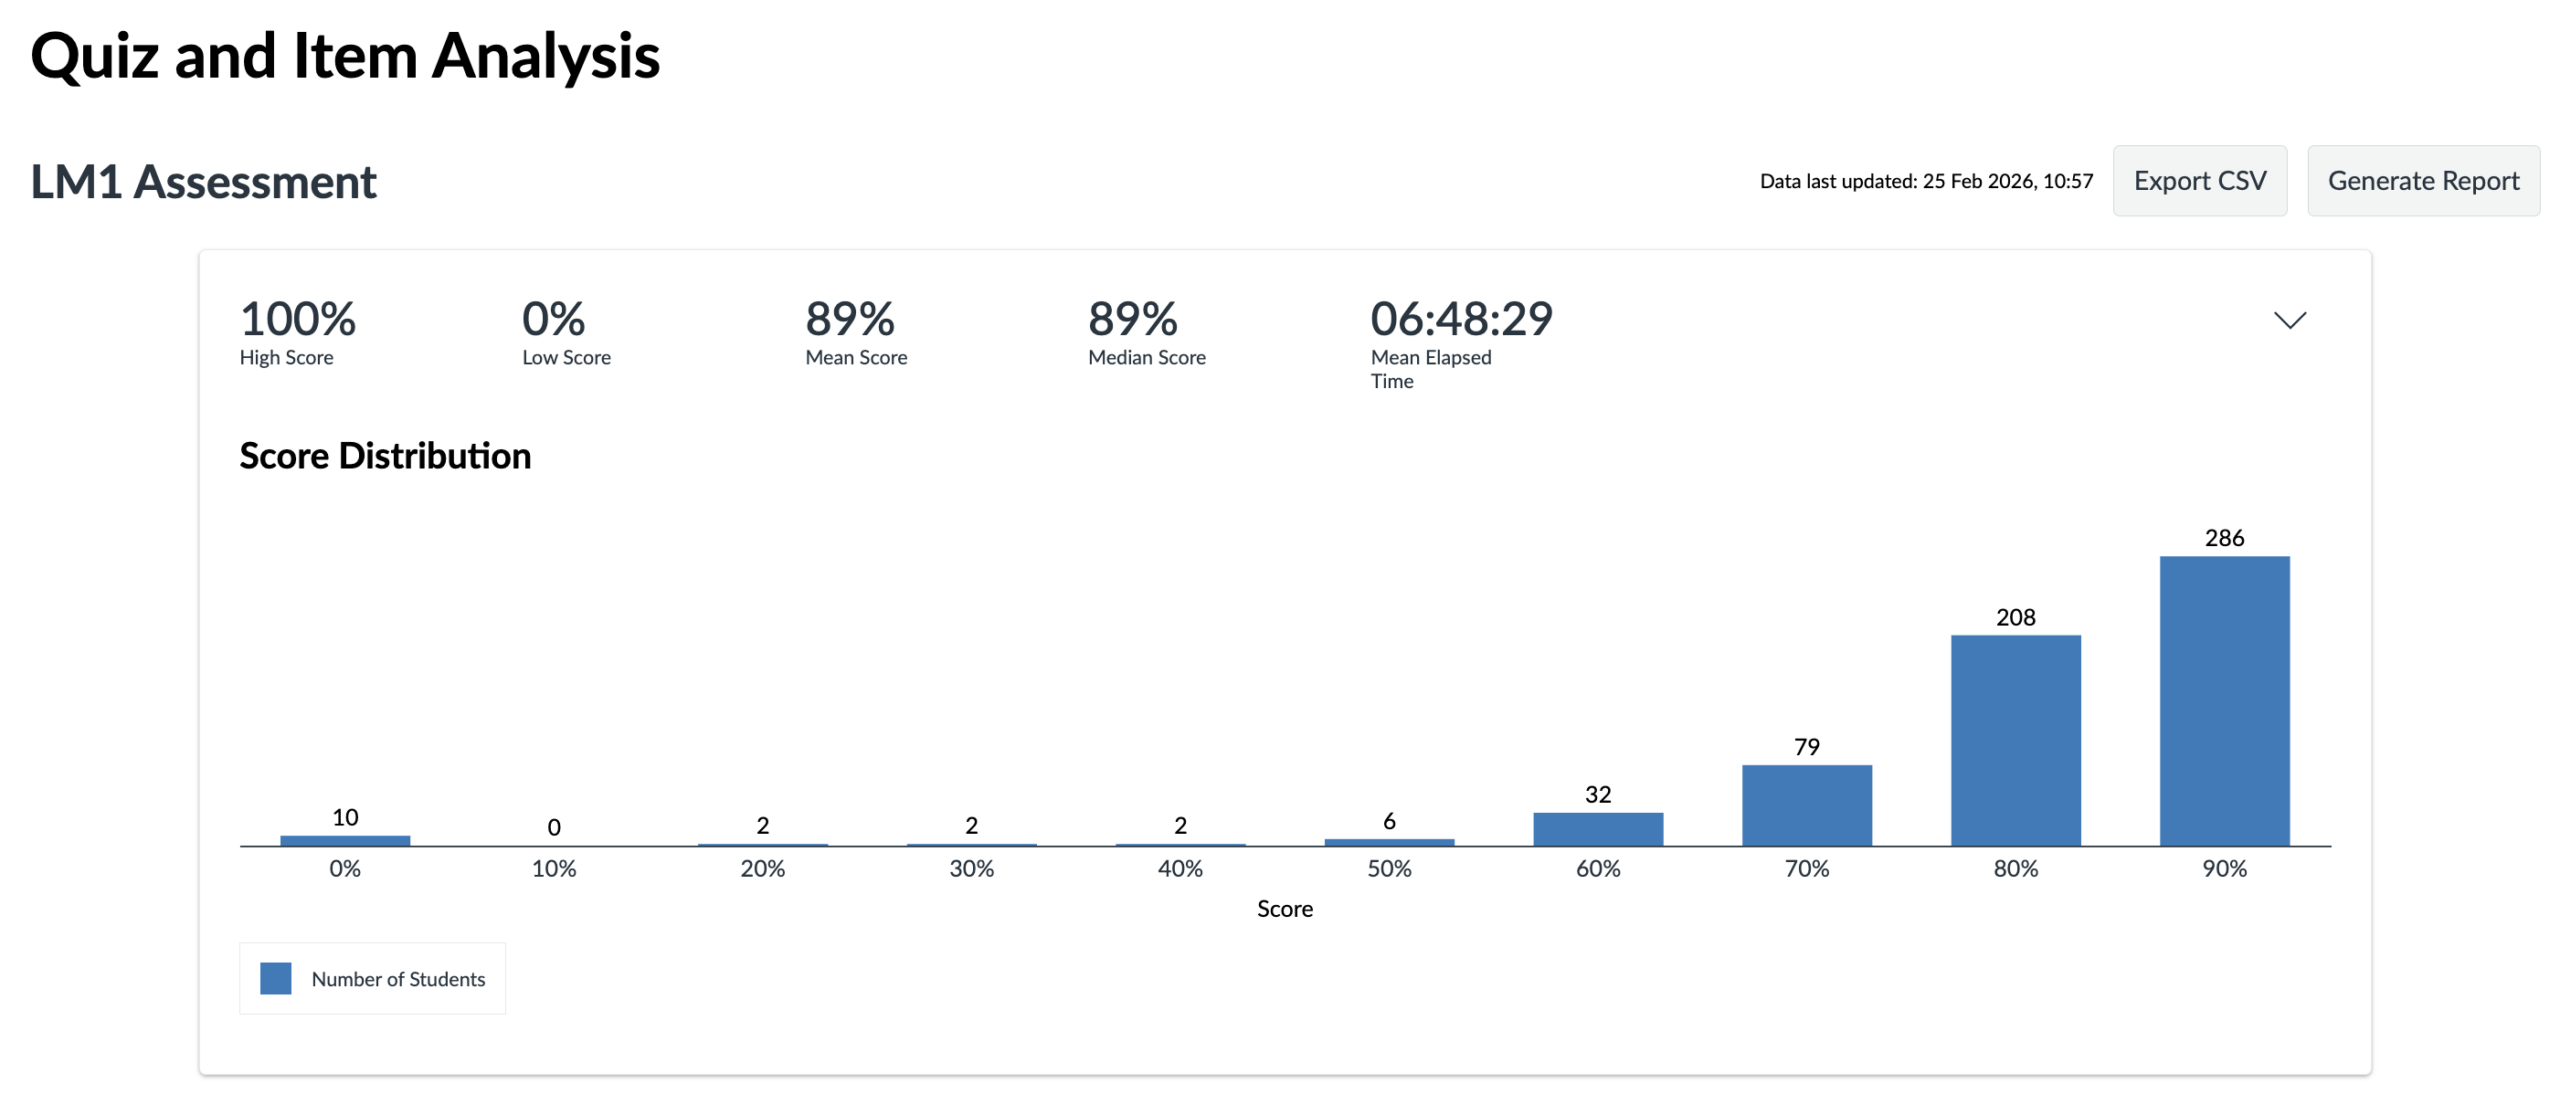
This report provides an overview of quiz performance across the cohort. It includes overall quiz results as well as question-level statistics, such as average score and item difficulty.
The example below shows a score distribution graph for a quiz, illustrating the range of scores achieved alongside the mean and median for the cohort.
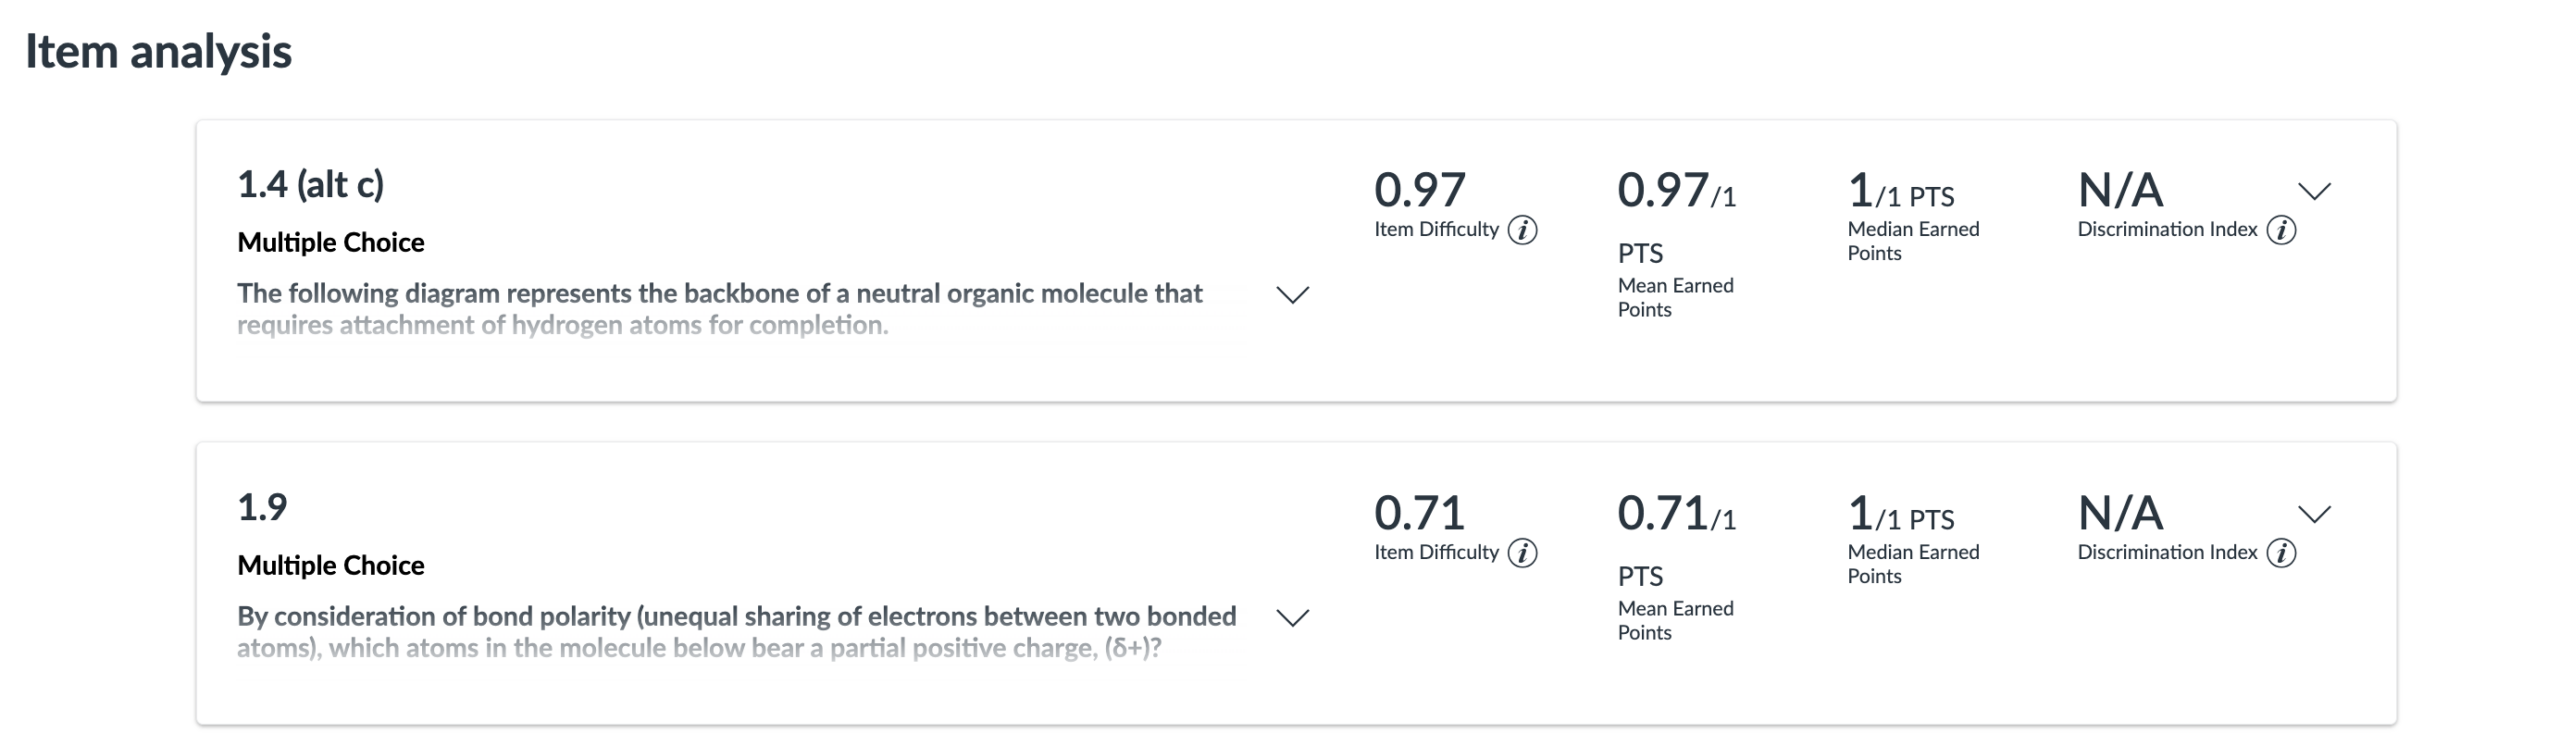
A further example demonstrates individual item (question) analysis. Here, you can view metrics such as Item Difficulty, which measures the proportion of students who answered a question correctly. These insights can help inform future teaching by identifying topics that may require additional support or clarification.
Outcomes Analysis ⬇️
This report relies on the use of the Outcomes feature in your course. Outcomes allow instructors to track student progress against specific learning goals or desired competencies. For more information, see: What are outcomes?
If you’d like to explore the use of Outcomes in your course, please get in touch.
Student Analysis ⬇️
This report provides instructors with detailed data on students’ quiz interactions. You can download a CSV file containing information such as:
- Time Elapsed
- Submission Attempts
- Item Type
- Student Response
- Points Earned
- Number of Correct
- Number of Incorrect
- No Response
- Overall Score
- Status